
Once a sandbox has finished analyzing an attachment, it generates a result and detailed sandbox logs. This article gives basic guidance on result levels and sandbox logs, so you can learn more about current and future malware encounters.
Result levels
The table below identifies how the sandbox classifies a file's result based on the activity it encounters during analysis.
| Result | Definition | Outcome | Recommended Admin Steps |
|---|---|---|---|
| No Risk Found |
The attachment did not exhibit threatening behavior of any kind during the testing period. | The file attachment is sent along with the message. No warnings are given. |
None. This file presented as safe within the designated testing period. |
| Suspect | The attachment exhibited suspicious behavior when activated. It could be malicious. Exercise caution. | The file is quarantined and displayed in the next Quarantine Report. Depending on Email Security user permissions, the file may be released from quarantine through the email portal. |
Review the Sandbox Logs for additional details regarding the activity experienced during the sandbox test. |
| Malicious | The attachment is comprised or contains known malware, or exhibited malicious behavior when activated. | File is quarantined and displayed in the next Quarantine Report. Malicious files can never be released. |
Review the Sandbox Logs for additional details regarding the activity experienced during the sandbox test. |
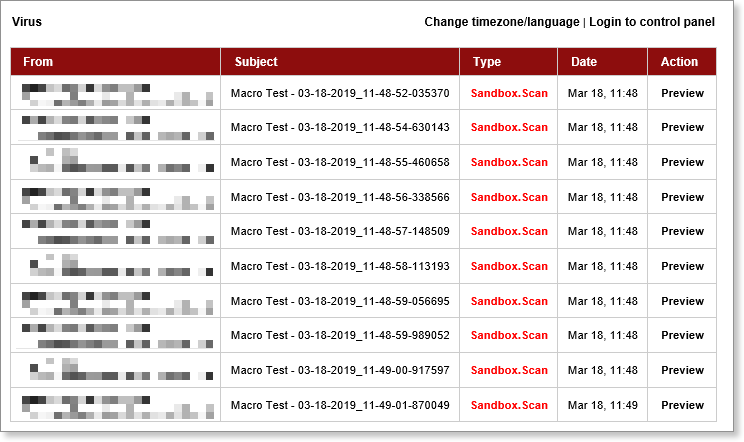
The Quarantine Report (above) displays all items sent to the user that are currently being held in quarantine. Quarantine Report delivery settings are specified by user within VIPRE Email Security.
Sandbox logs
All sandboxed email messages — anything processed by Attachment Sandboxing — are flagged in VIPRE Email Security's Message Logs with a status of “Sandbox”.
In addition to the standard Message Logs actions (Allow, Deny, Export), you can view the detailed Sandbox Logs, which is where the most relevant analysis information is kept.
How to view the sandbox logs
- Click Message Logs
- On the right side of a message row, click the View icon

- When viewing a message, click the Sandbox Logs tab
- Expand/collapse sections in the Details area to dig further into details identified during sandbox analysis
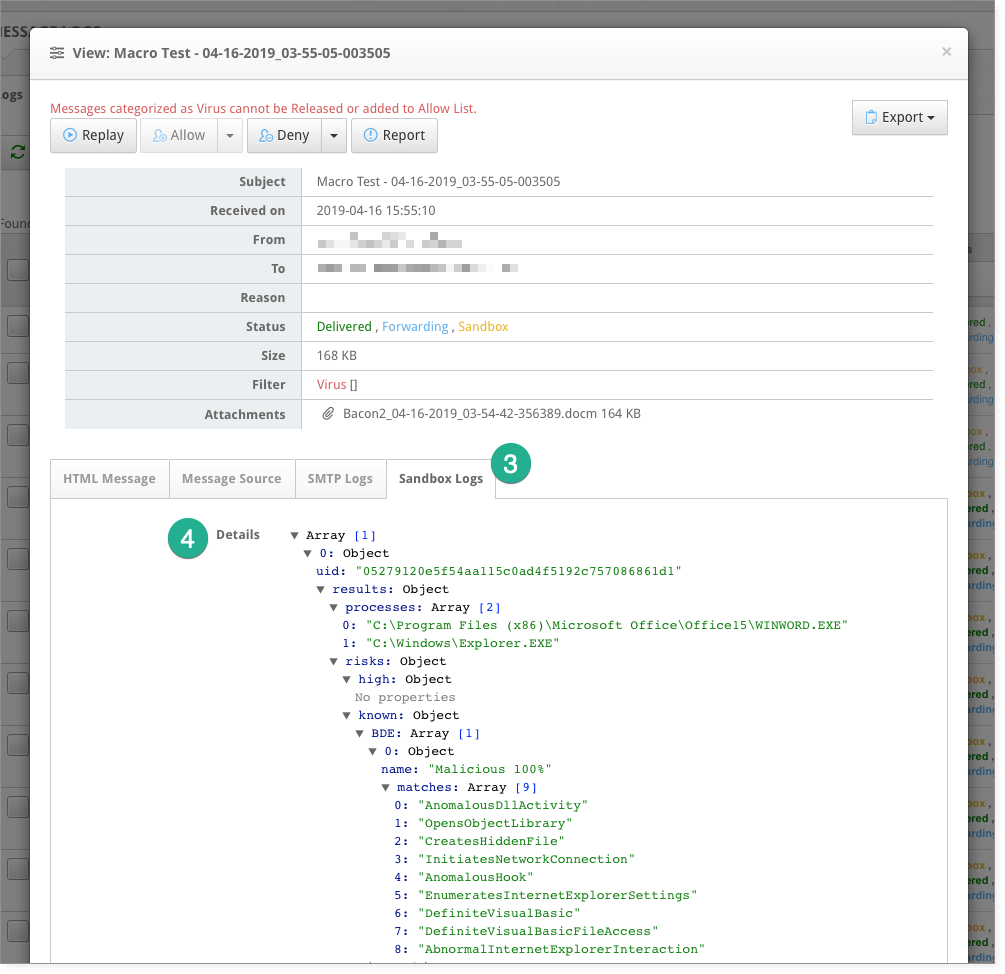
As an example, a file is probably suspect if it
- spawns additional processes without permission
- looks for active monitoring tools which might be watching it
- attempts to emulate system Windows processes
Although the information presented in the Details section is technical, it should be relatively discernable as to why the sandbox made its result determination.