
A high-level overview of the Dashboard's major areas and functions. We also explain which sections are historical vs. real-time data, and how to know immediate action is needed.
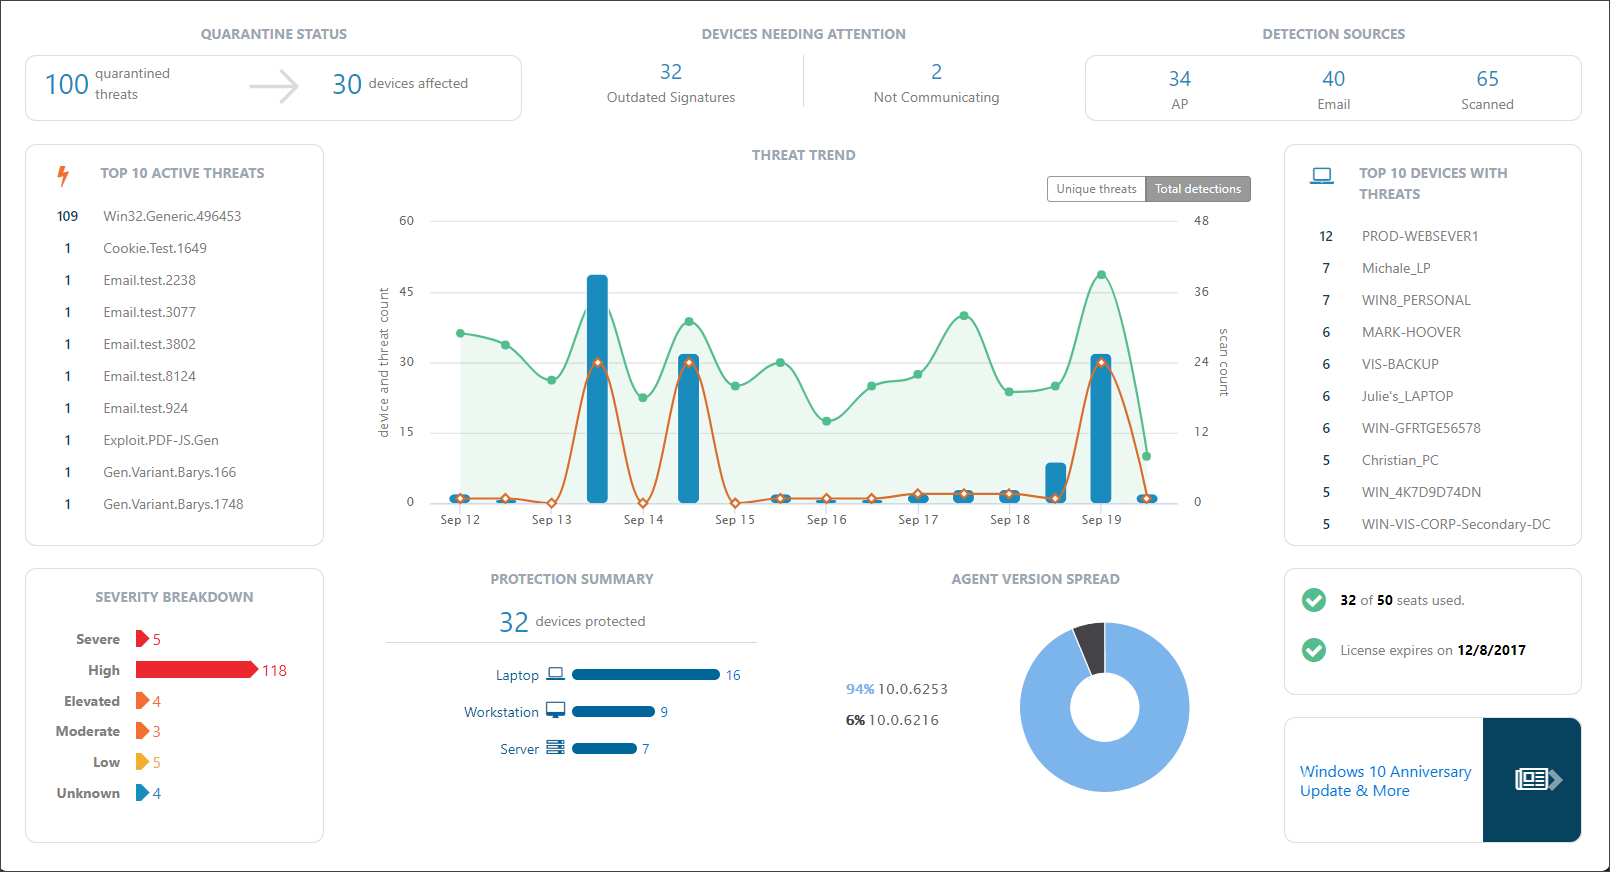
Front and center in VIPRE Cloud, and the first screen you see when you log in, is the Dashboard. The Dashboard is a one-stop shop to get a quick picture of the overall security posture and health of your environment. Each highly consumable section provides insight into a particular area of VIPRE's protection.
Explore the areas of the dashboard
The VIPRE dashboard is a great starting point to keep your environment safe. Nearly every aspect of the dashboard provides drill down capabilities that provide lots of detail about specific threats.
Click on the images below to see a larger version.
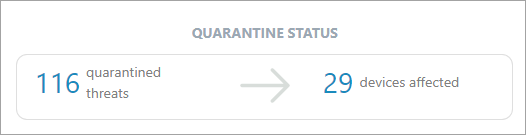 |
Quarantine Status A real-time summary of the number of threats currently in quarantine and how many different devices those threats were found on.You can drill down here to delete those threats or unquarantine any file that is verified as accidentally quarantined (a false positive). The new quarantine counts will be immediately reflected on the dashboard. |
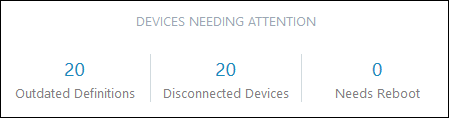 |
Devices Needing Attention A summary of devices that may be having trouble because they
You will want to investigate these devices to ensure that all of your systems stay protected. As each device issue is resolved, the counts will be updated on the dashboard. |
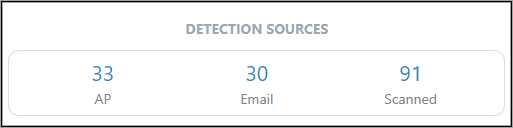 |
Detection Sources A historical summary of discovered threats and which VIPRE engine detected them
|
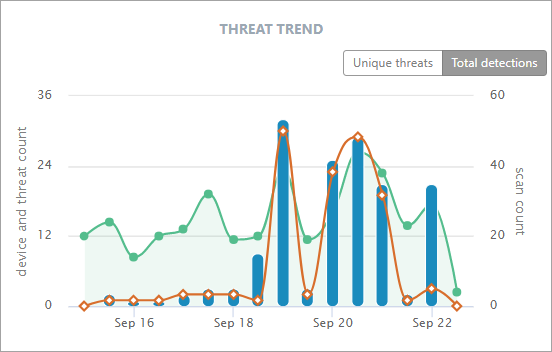 |
Threat Trend A historical timeline summary of the threats we've seen. Each day is broken into 2 x 12-hour periods. The three data groups shown are
You can use the toggle switch at the top-right to swap the graph data between all threats or just unique threats (e.g. if the same virus is found on three endpoints, those will be shown as one unique threat). |
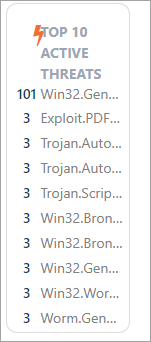 |
Top 10 Active Threats A historical summary of the Top 10 active threats. Use to ensure that no particular threat is infecting your environment. An excessive count of a threat is an indication of a widespread issue. Drill down into a threat for more details on the threat itself, the devices it has impacted, and how it was detected. |
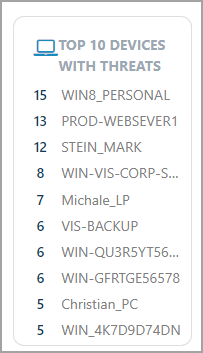 |
Top 10 Devices With Threats A historical summary of the Top 10 Devices with threats. Use this to identify which devices may be particularly susceptible to threats and that may be a particular risk to your environment. |
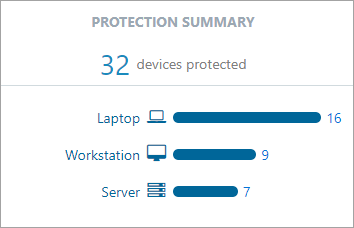 |
Protection Summary View a breakdown of the number of devices in each category that VIPRE is currently protecting. |
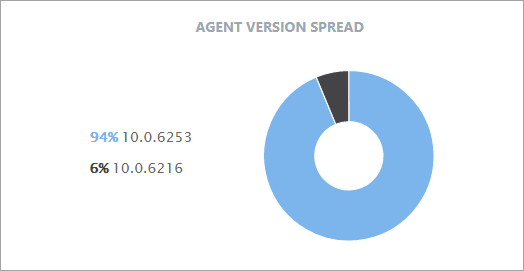 |
Agent Version Spread View a summary of the agent software versions that are currently deployed or available.We are continuously improving our engine detection technology, so it is always a good idea to keep your agents up to date! |
How to view a different date range
By default, the Dashboard shows data for the last seven days. You can drill down on particular items of interest to explore more information and customize your timeline.