
A visual guide to key areas of the VIPRE Cloud UI, with navigation tips and tricks.
Interact with VIPRE Cloud
The VIPRE Cloud user interface was designed to be easy to use and simple to understand. This article serves as a quick reference for new users, as well as a collection of tips and tricks to help make your threat exploration experience as smooth as possible.
General Navigation
|
Item |
Description |
Example |
| Hover data |
Hovering over data points on a chart or graph will often reveal quick information at a glance. |
 |
| Drilling into data |
You can often select graphical data items to drill into or explore a data set. |
Select a point on a timeline ...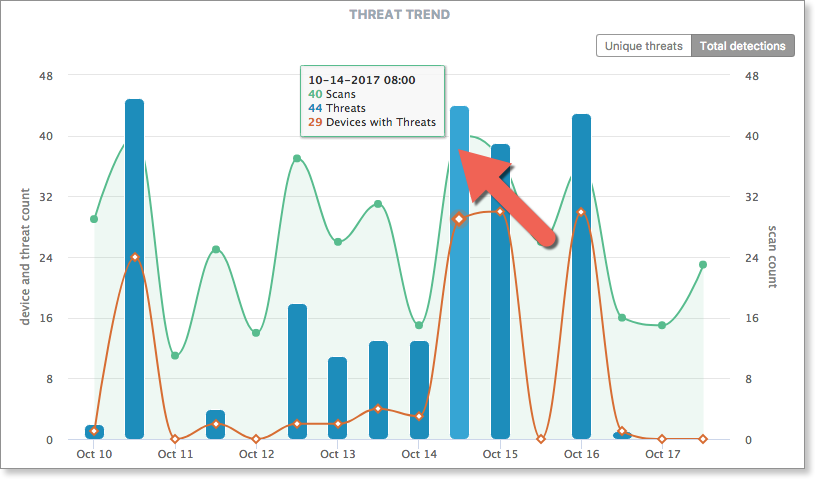 ... to run a custom threat report with that specific data. ... to run a custom threat report with that specific data.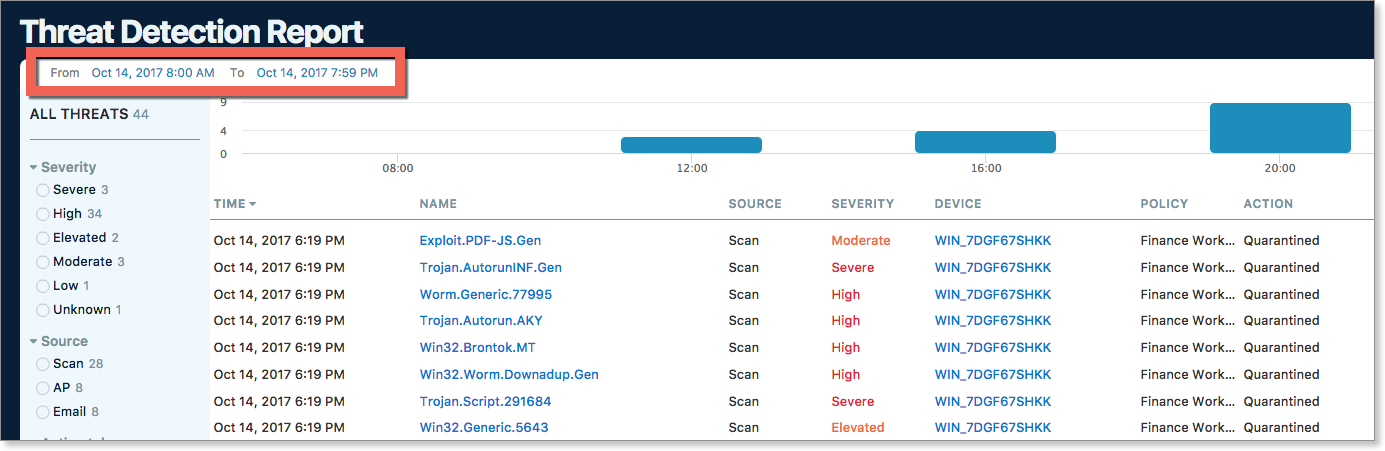
|
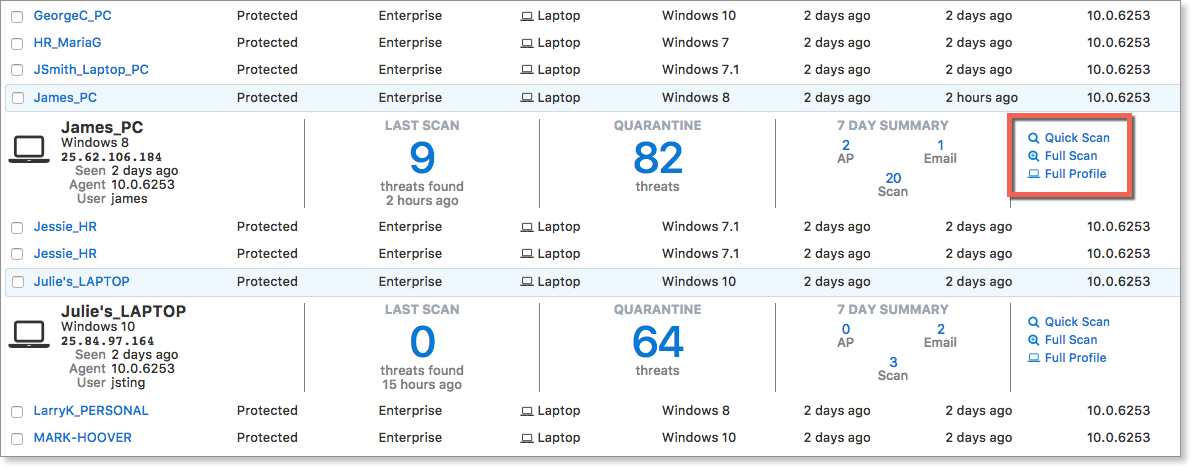
| Expand rows for additional information |
For information displayed in a table, selecting the row will usually expand it to show additional information and shortcut actions.Selecting multiple rows enables you to perform quick comparisons of key information. |
 |
| Expand rows for quick shortcuts |
Expand a row by selecting it to show common shortcut actions, like kicking off a scan, or viewing a device's full profile. |
 |
| Perform actions on multiple items |
Select multiple items, then choose an action to act on all selected items at once. |
.gif) |
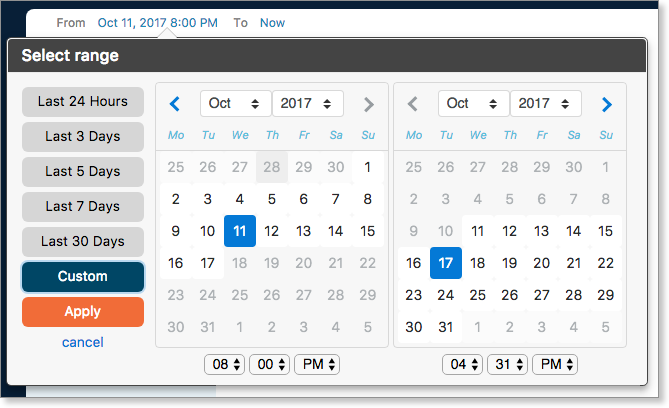
| Select quick dates or custom date ranges |
Select the From or To date ranges to adjust the range of data using handy date shortcuts, or select a custom range to display. |
 |
| Timeline active filter shortcuts |
When you select an event bar in a timeline, the data changes to show relevant information. |
 |
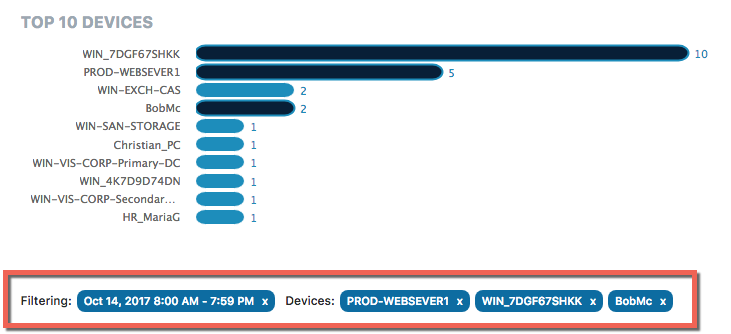
| Multiple item filter selection |
On some screens you may select multiple items to create a multi-layered filter for the on-screen results.In this example, we have selected a specific timeline as well as three additional devices, to hone in on a specific issue.Select the x on a filter item to remove it, or select reset to clear them all. |
 |
| Display additional options |
To make the display tidier, some options only show when their parent option is enabled.Selecting an option to enable it may present additional sub-options. |
 |
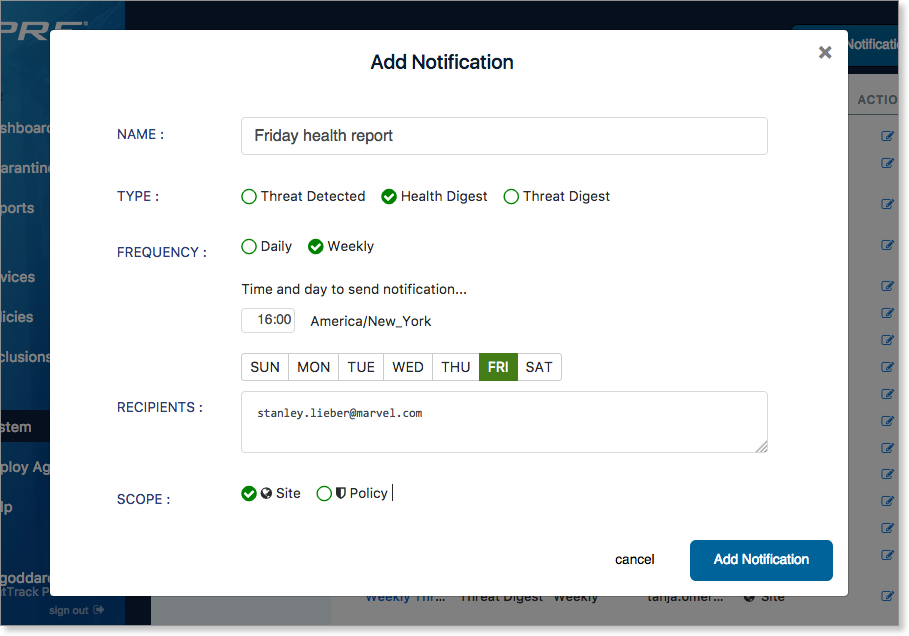
| Pop-over windows |
Some selectable items (buttons, links, icons) display a pop-over window. This is used to present additional information about an item, or to display a form. |
|
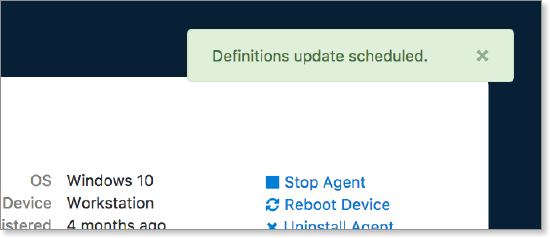
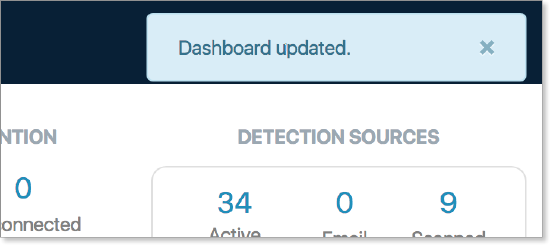
| On-screen notifications |
Some actions or events will trigger an on- screen notification in the top right of the display. Green notifications indicate an action has begun, such as when you request a device update its definitions. Blue notifications indicate information has been updated, such as when the Dashboard refreshes. Red notifications indicate a critical event or system error. |
|
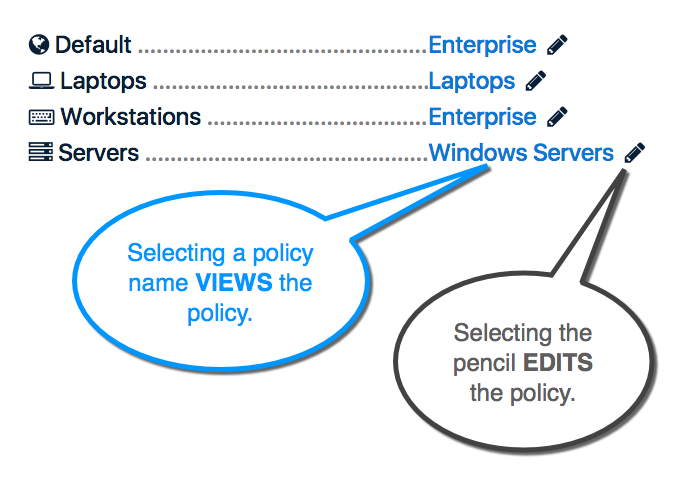
| Quick View vs Quick Edit |
In general, selecting an item's name views the item, while selecting the pencil next to an item edits the item.
|
 |
| Add Another |
When adding multiple items (such as exclusions), check add another to enable continuous input. |
.png) |
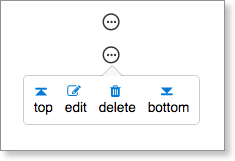
| (•••) hidden actions |
Sometimes available actions will be condensed to save space. Select a (•••) to display an item's other actions. This particular example appears in Policies > Firewall > Application Rules. |
 |
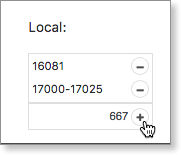
| ⊕ / ⊖ selectors |
Some custom lists (such as firewall ports) allow you to add/remove items.Enter text and select ⊕ to add it to the list, or choose an existing item in the list and select ⊖ to remove it. |
 |
| ▲ / ▼ sorters |
Some items can be moved up and down in a list to change their priority. Select either ▲ or ▼ next to an item to change its priority. |
 |
Dashboard
|
Item |
Description |
Example |
| Dashboard Total vs. Unique threats |
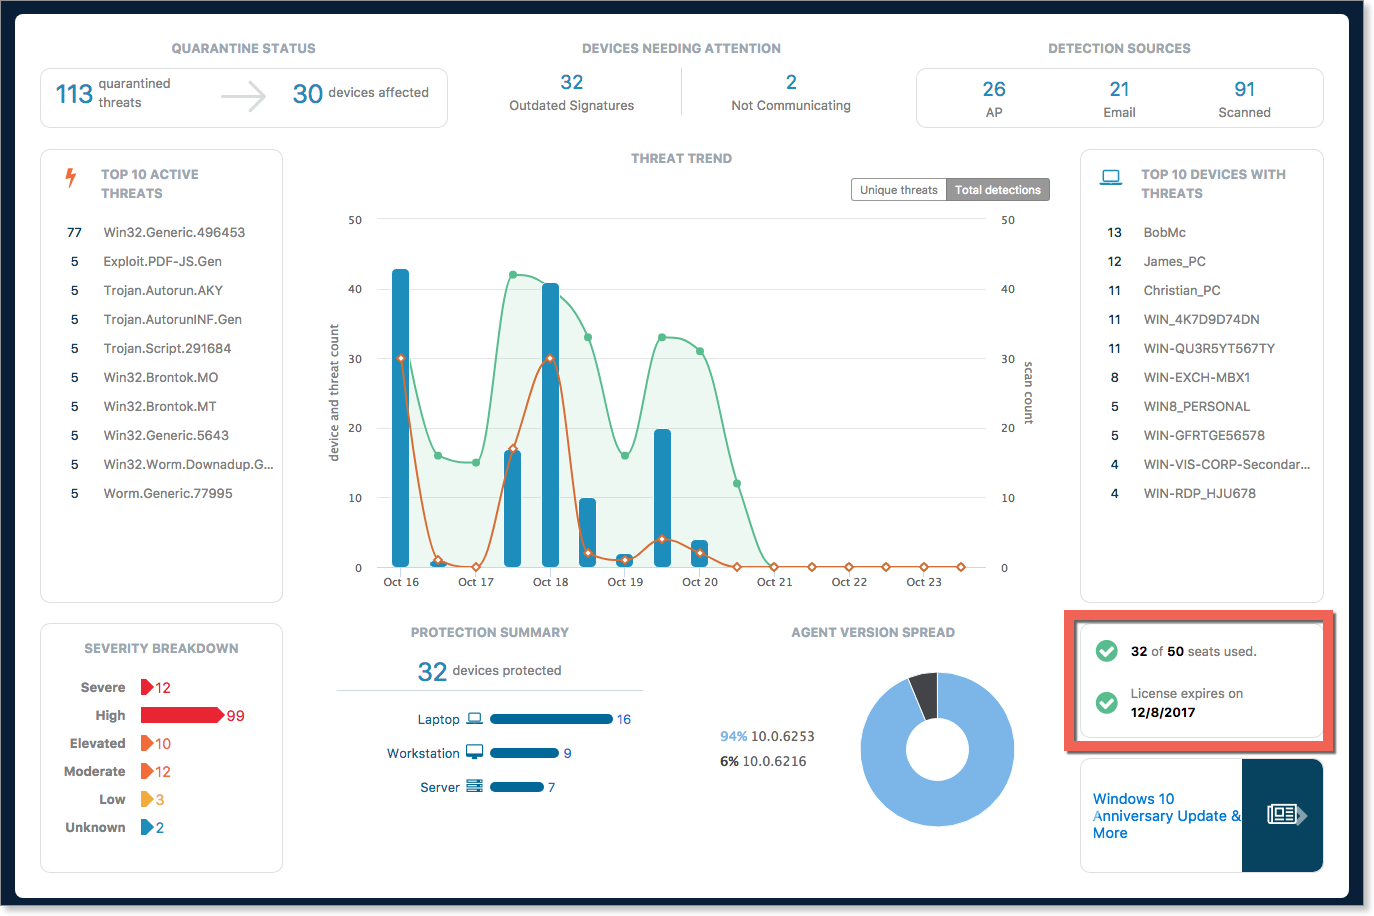
On the Dashboard Threat Trend section, you can select the toggle switch to change between viewing Total detections (counting all instances of threats found) and Unique threats (only counting a threat's first detection). |
 |
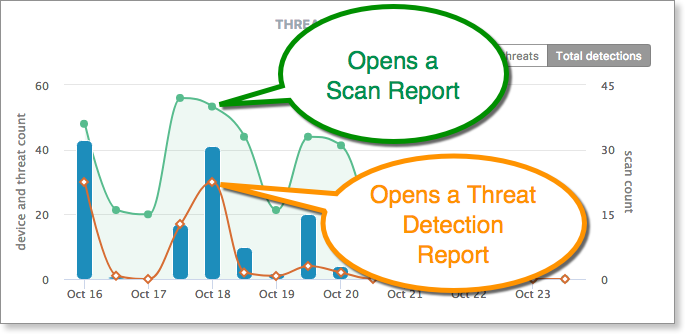
| Dashboard Threat Trend report links |
Selecting a Green point on the trend will open a Scan Report for that period.Selecting an Orange point will open a custom Threat Detection Report for that period. |
 |
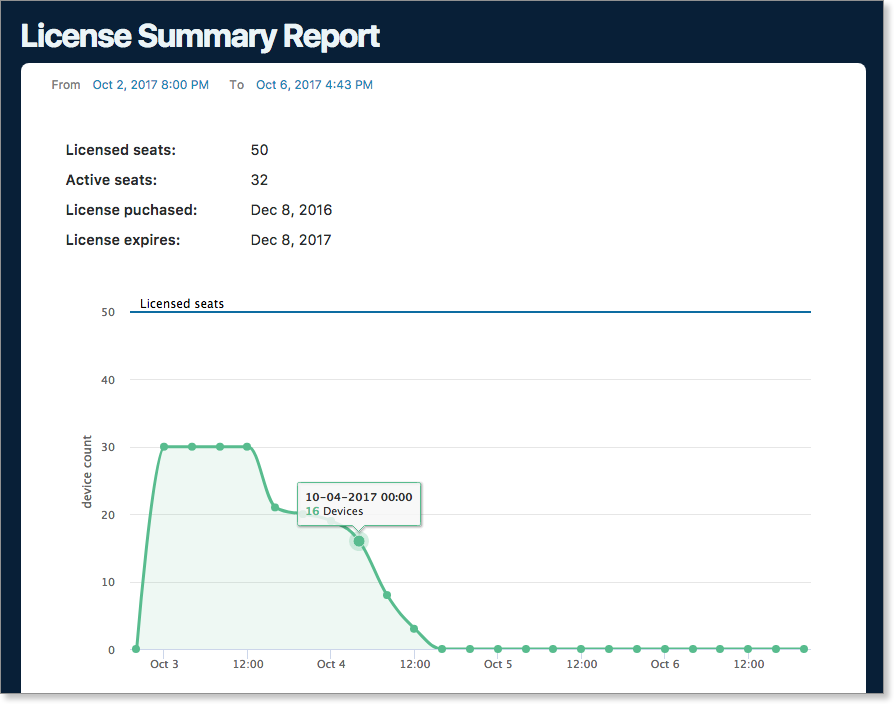
| Dashboard License summary shortcut |
On the Dashboard, selecting the license info box displays your License Summary Report. |
|
Scan Report
|
Item |
Description |
Example |
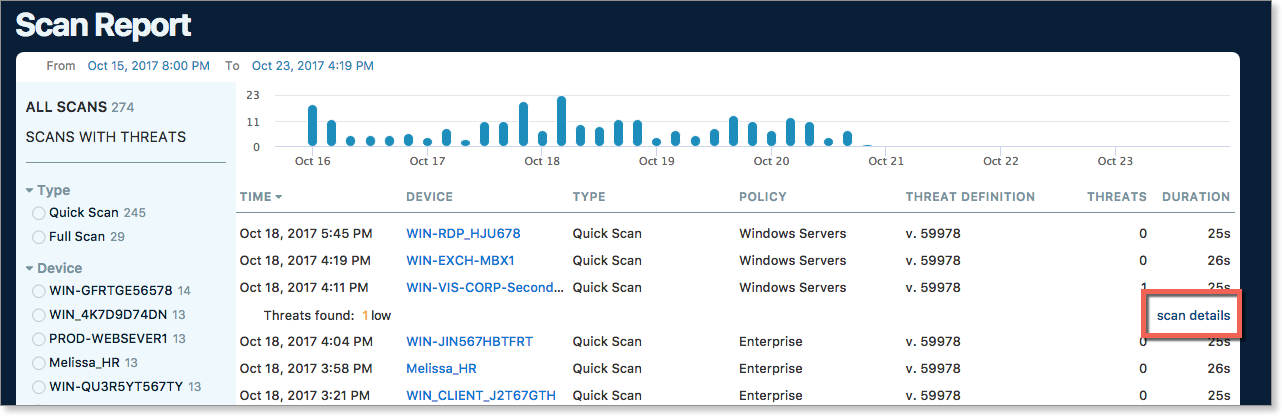
| Scan Report -Details |
On a Scan Report, expand a row and select scan details to display even more information. |
 .png)
|