VIPRE Cloud's interactive analytics reports are the best way to review what VIPRE has learned about your security health. This article serves as an introduction to each.
You can access VIPRE's reports at any time through the Reports menu item on the left, or by clicking most items on the Dashboard, or from within your email digests.
In fact, VIPRE Cloud uses these report screens as its primary method of displaying data. Almost every informational link within VIPRE Cloud displays additional data through a report view. In this way, reports are a primary method of interacting with VIPRE Cloud and navigating through current and past threat trends.
Threat Detection Report
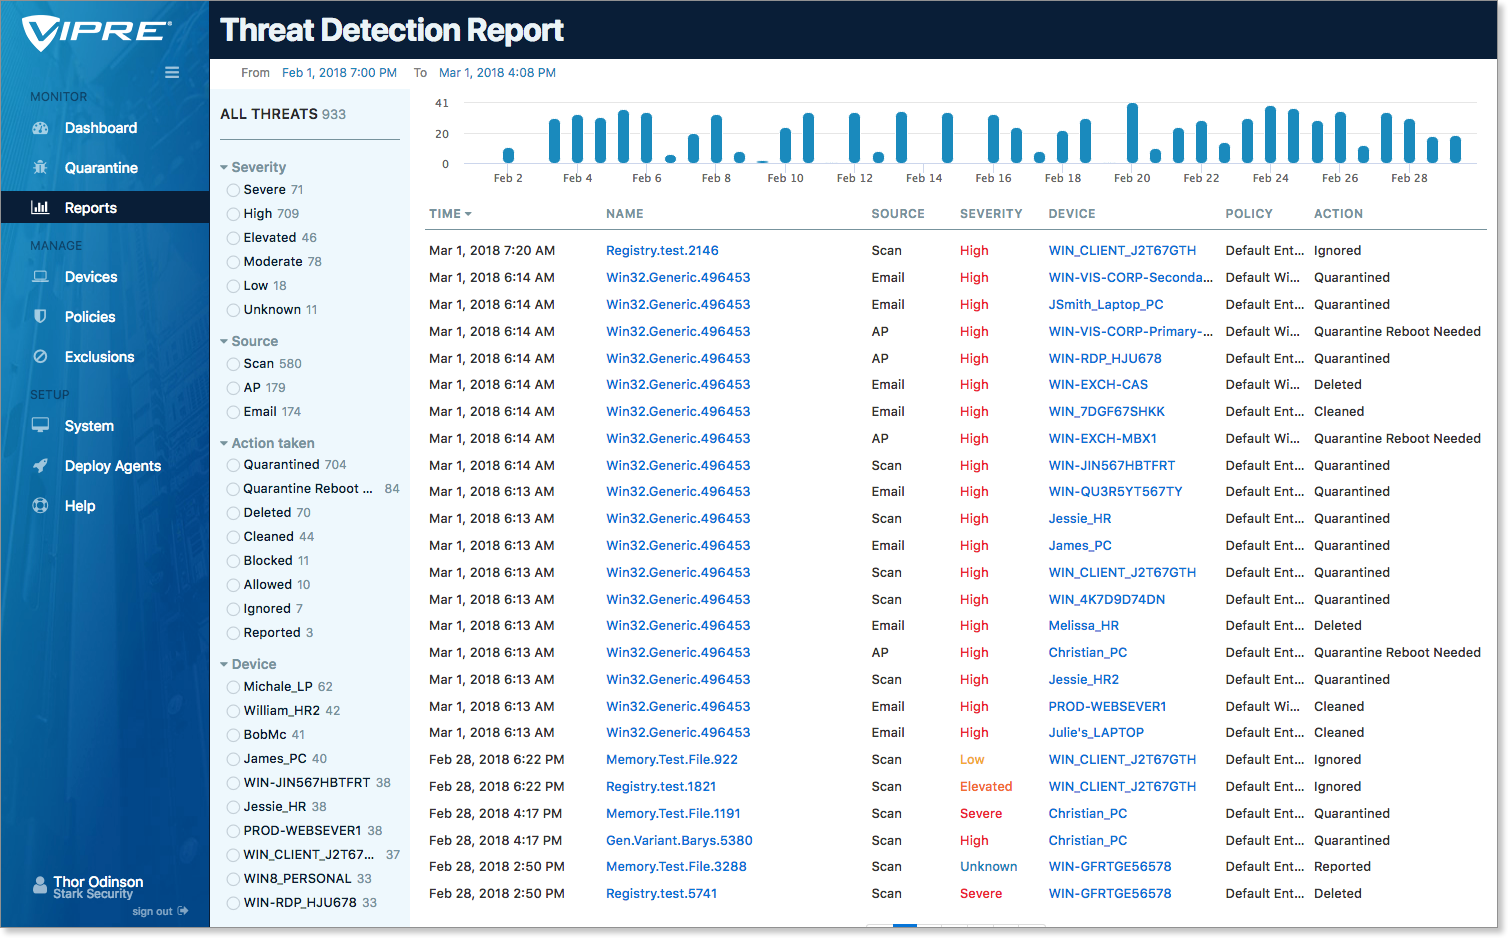
The Threat Detection Report provides an easy-to-understand summary of how your systems were targeted, with a day-to-day timeline of detected threats. Quickly filter by Threat Level, Source, Action Taken, or Specific Device using the filters on the left. Adjust the date range on the upper left of the display to help narrow down a threat timeframe.
Clicking a filtered item immediately updates the rest of the display allowing you to see the most relevant information. For example, if a particular segment on the timeline displays a disproportionately high number of threats, clicking on the blue bar for that range immediately filters the view to only that time period.
Threat names and device names are links that take you deeper into the details for those items. For example, select a device name to drill into the Device Detail screen for that endpoint. Select a threat name to dive into details for that threat on the Threat Summary Report.
Threat Summary Report
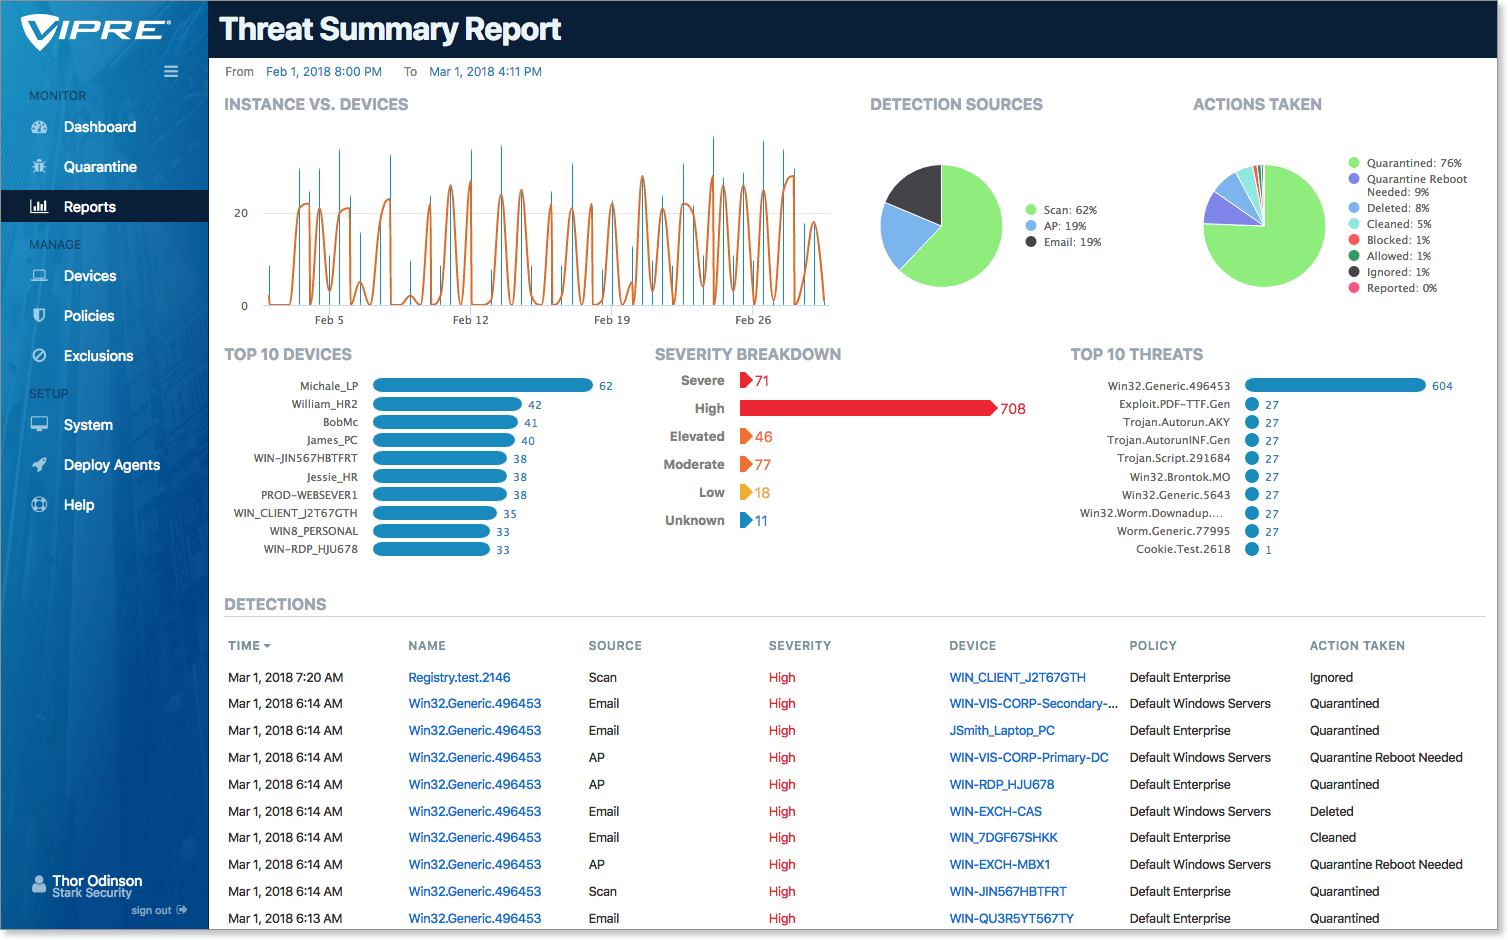
While the Threat Detection Report displays threats along a timeline, the Threat Summary Report enables you to drill down and gain insight on threats VIPRE has blocked, quarantined, or deleted. There are many interactive sections on the Threat Summary Report, which adjust to display information relevant to your choice.
The following are brief descriptions of the Threat Summary Report sections:
Instances vs. Devices
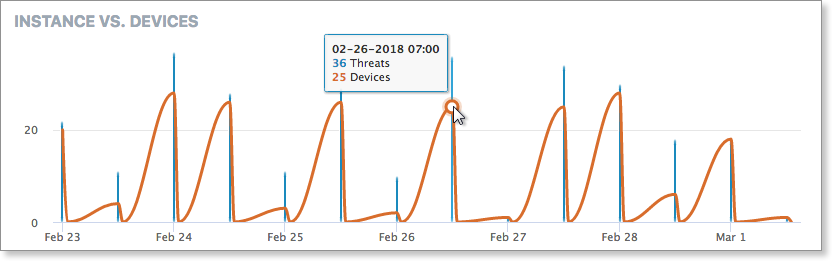
Instances vs. Devices correlate threats to devices for a given period, providing a focus on the devices that are most vulnerable.
This display shows, by detection period, the number of threats (blue) as well as the number of devices WITH threats (orange) on your network. Hovering over any given data point will display the particulars. Selecting a blue bar immediately adjusts the rest of the on-screen data to match that point in time.
Detection Sources
The Detection Sources chart highlights which VIPRE engine discovered the selected threats. By knowing the threat vectors and how they attacked your devices, you can draw some conclusions about where you might need to shore up your defenses.
- Scan - VIPRE’s primary scanning engine. Scans files for malware, viruses, etc.
- Email - VIPRE’s email scanning engine. Scans local email messages for malicious URLs and attachments.
- AP - VIPRE’s Advanced Active Protection. This is the “on-access” scanner that detects suspicious activity for executables or applications in memory.
Selecting sources in the Detection chart further filters the on-screen information.
.png)
Actions Taken
The Actions Taken chart shows how VIPRE handled processed threats. A file could have been quarantined or deleted; an email might have been cleaned; a bad URL might have been blocked. Here you can see which actions were taken.
As in Detection Sources (above), select a piece of the pie to adjust the current filter and effect the detailed Detections listing below.
.png)
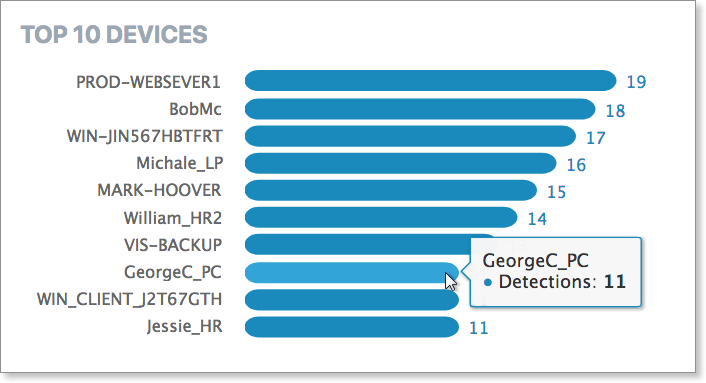
Top 10 Devices
Top 10 Devices lists the top ten devices with threats found on your network.
In general, this data reflects the devices on your network that are most prone to threats at a given time. Selecting the devices in this list also allows you to add/remove from the current Threat Summary filter, which is automatically reflected on the rest of the screen items.
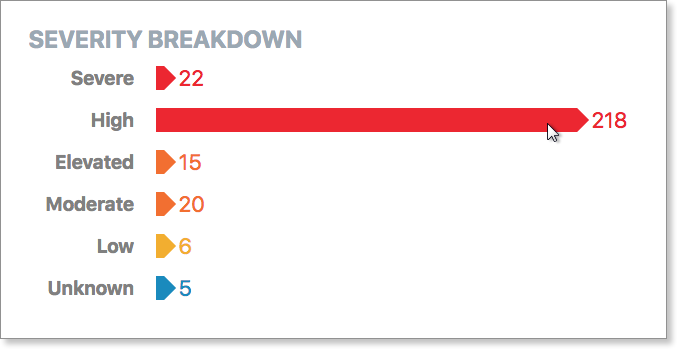
Severity Breakdown
This is your intelligence report on the threat levels discovered over the given time period.
The Severity Breakdown shows the number of threats for each threat level that have been processed by VIPRE for the given period. Threat levels are color-coded and fall into 6 categories, severe, high, elevated, moderate, low, and unknown.
Selecting a threat level (or multiples) here will filter the data on the rest of the screen.
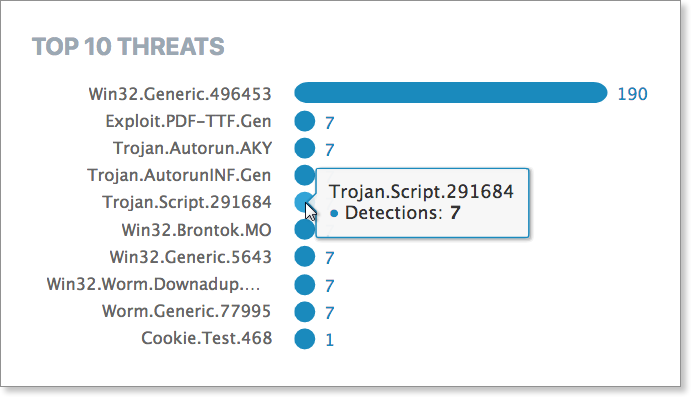
Top 10 Threats
Top 10 Threats shows the top threats across all devices in your network for the selected period. You may select a single threat or multiple threats here to filter the on-screen results to match.
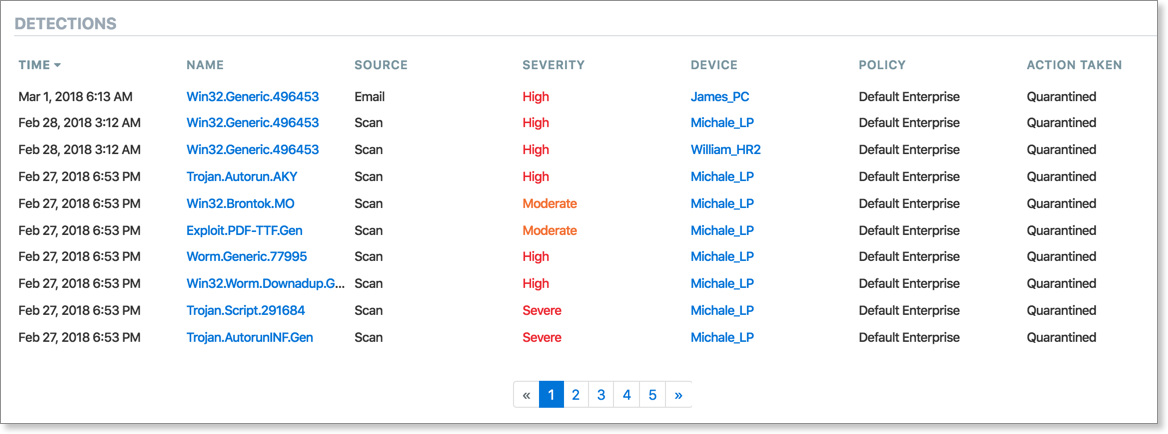
Detections
The Detections section, constantly updated whenever you select or filter information above, correlates much of the above information in a simple interactive table. Here, you can click on a threat name (in blue) to dive into the Threat Details screen for that threat, or a Device Name to drill down into that device.
By default, the Detections section is sorted with the latest threats at the top; clicking the column headers allows you to re-sort as needed. Note the tabs on the bottom of the report allow for navigation between multiple pages (if applicable).
Device Registration Report
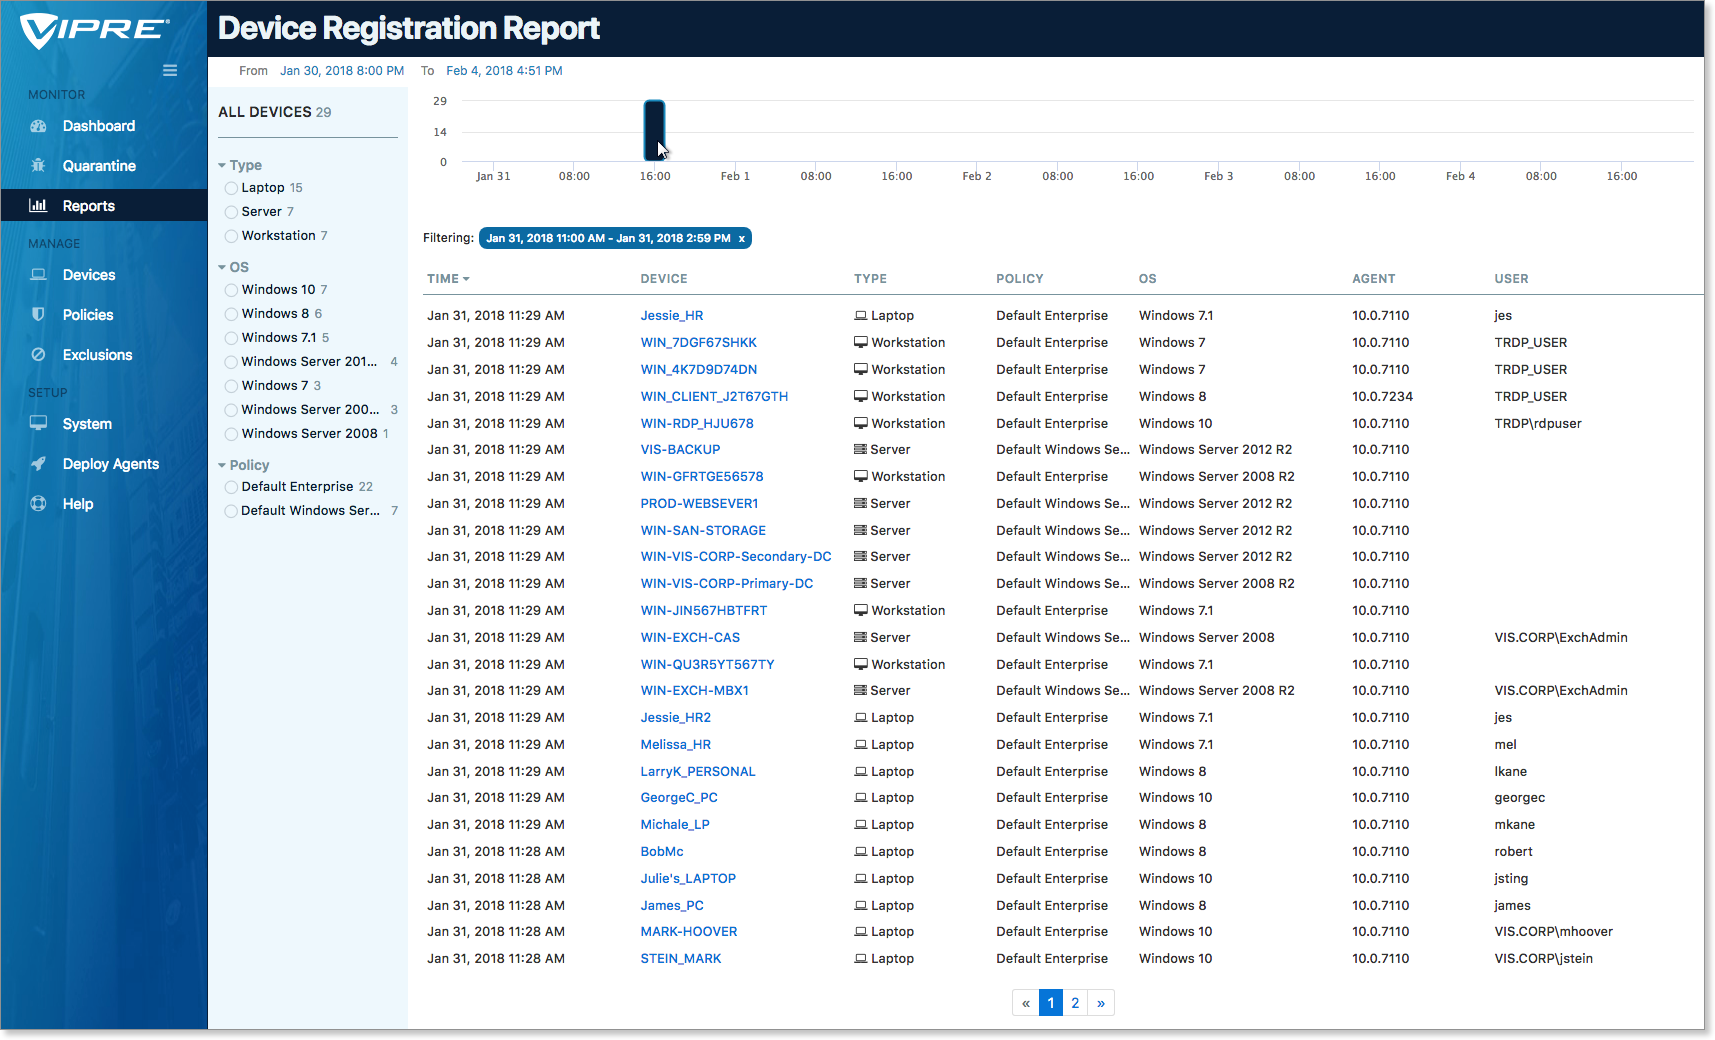
The Device Registration Report is an inventory of all devices registered and protected by VIPRE Cloud. This report allows for a deep-dive into when the devices were registered. Whereas the Devices screen shows current devices, you can use this report to pull up a history of all your devices and when they first were connected to VIPRE Cloud.
Click through Device names to view the Device Details screen. Data here includes the name of the device, its type, what detection policies are in effect, the operating system, agent, and user.
Removing the VIPRE agents from a device releases a paid seat (license), allowing an agent install on a different device.
Having a handle on device details is an additional tool for hardware resource management. All an organization’s devices can be isolated by OS, which might be useful for future software patches, OS upgrades, and budget planning.
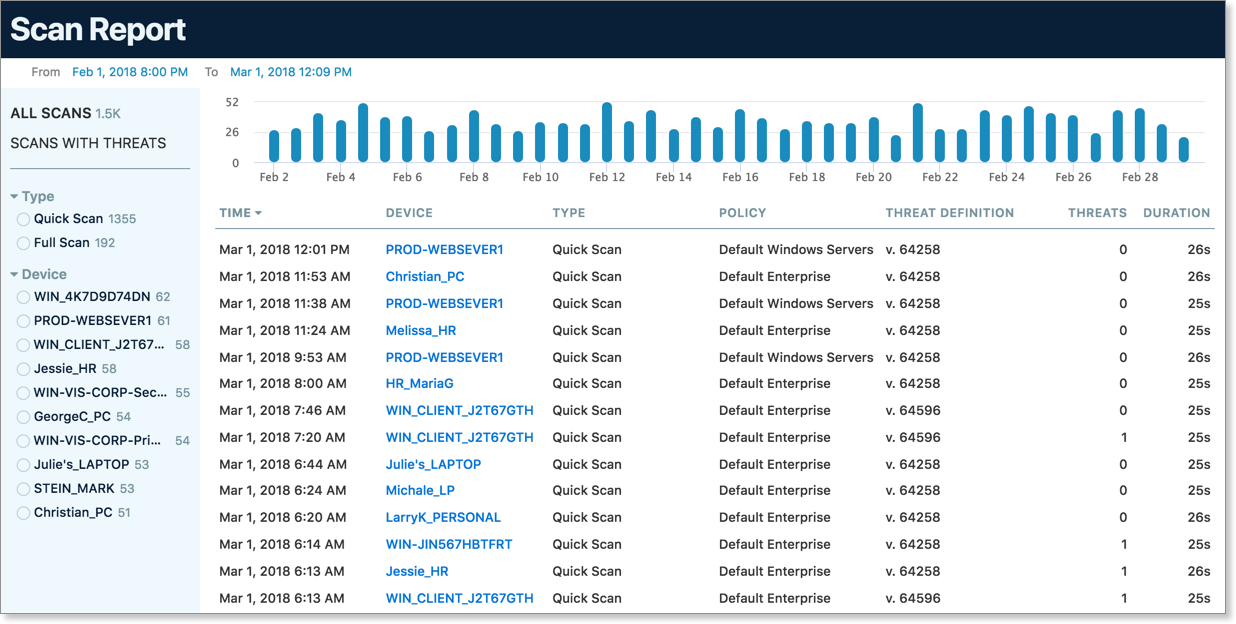
Scan Report
Monitor VIPRE's scan activity with this inventory of scans per device. As in the Threat Detection Report, you can (and should!) select specific and custom date ranges by clicking on the “From” date at the top of the report.
Filter the report by selecting Type (Quick Scan or Full Scan) or filter by specific devices. You may choose All Scans (default) or limit to only Scans With Threats for a quick overview of scans where threats were discovered.
You could use this report as a resource to track compliance. For example, see which scans were running on any particular day during a threat incident. Or, businesses with AV requirements can show VIPRE Cloud is actively protecting their devices and verify that scans are running as expected and as scheduled. Customers subject to both internal and outside compliance audits can tap into this report for proof of compliance.
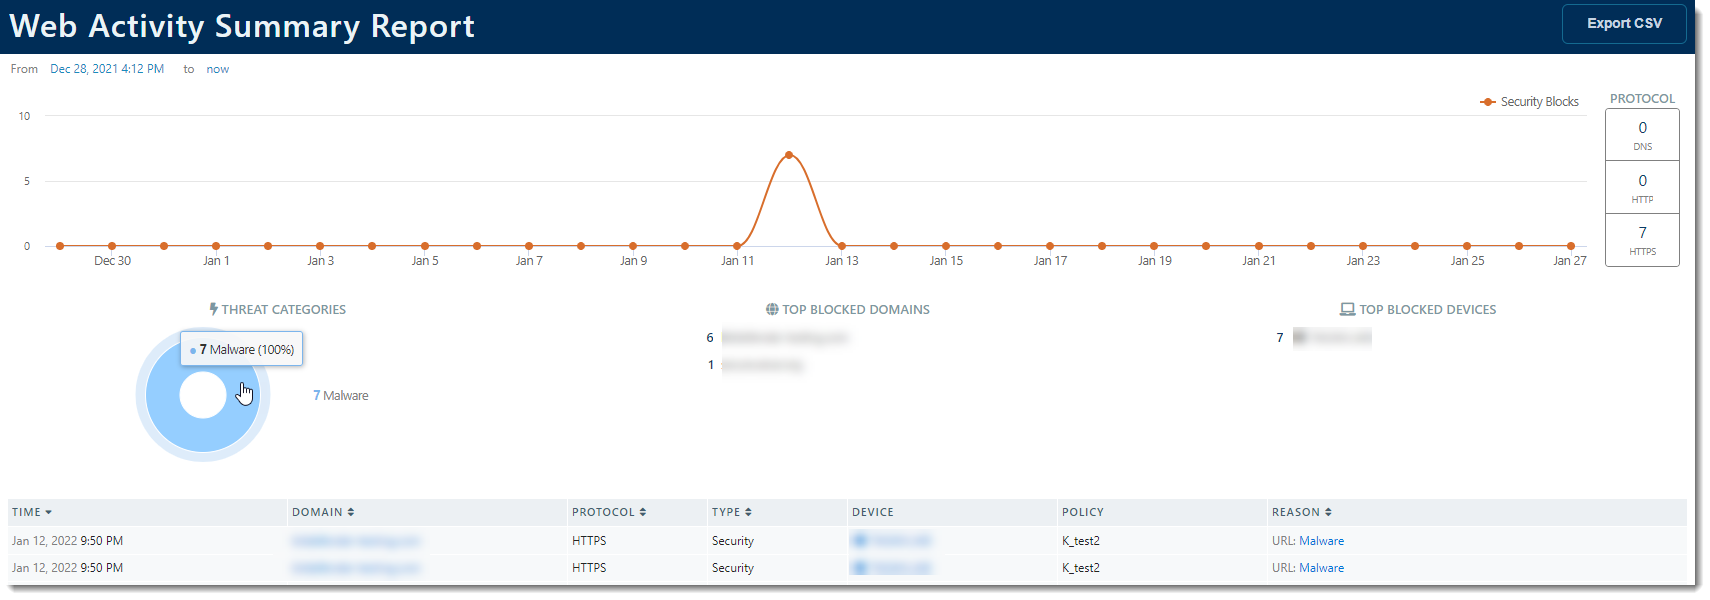
Web Activity Summary Report
The Web Activity Summary Report displays a list of blocked domains and the devices that attempted to reach them. The presented table provides:
- The date and time the domain was accessed
- The domain that was accessed
- The protocol used to access the domain
- The hostname of the device used to access the domain
- The policy that device belongs to
- The reason the offending domain was blocked
License Summary Report
Keep tabs on your VIPRE Cloud licensing with this numerical chart, which displays the number of licensed seats on your network. Confirm here that you have enough licenses available for a scheduled agent deployment, for example, or confirm that a group uninstalls succeeded properly. Unexpected gaps in licensing can be further investigated by correlating the dates/times with other reports.
- Licensed seats: How many devices the license you purchased will cover
-
Active seats: How many devices you actually have protected; in the example below, there are 32 out of 50 devices currently protected
- The number of devices shown here updates every 24 hours
.png)
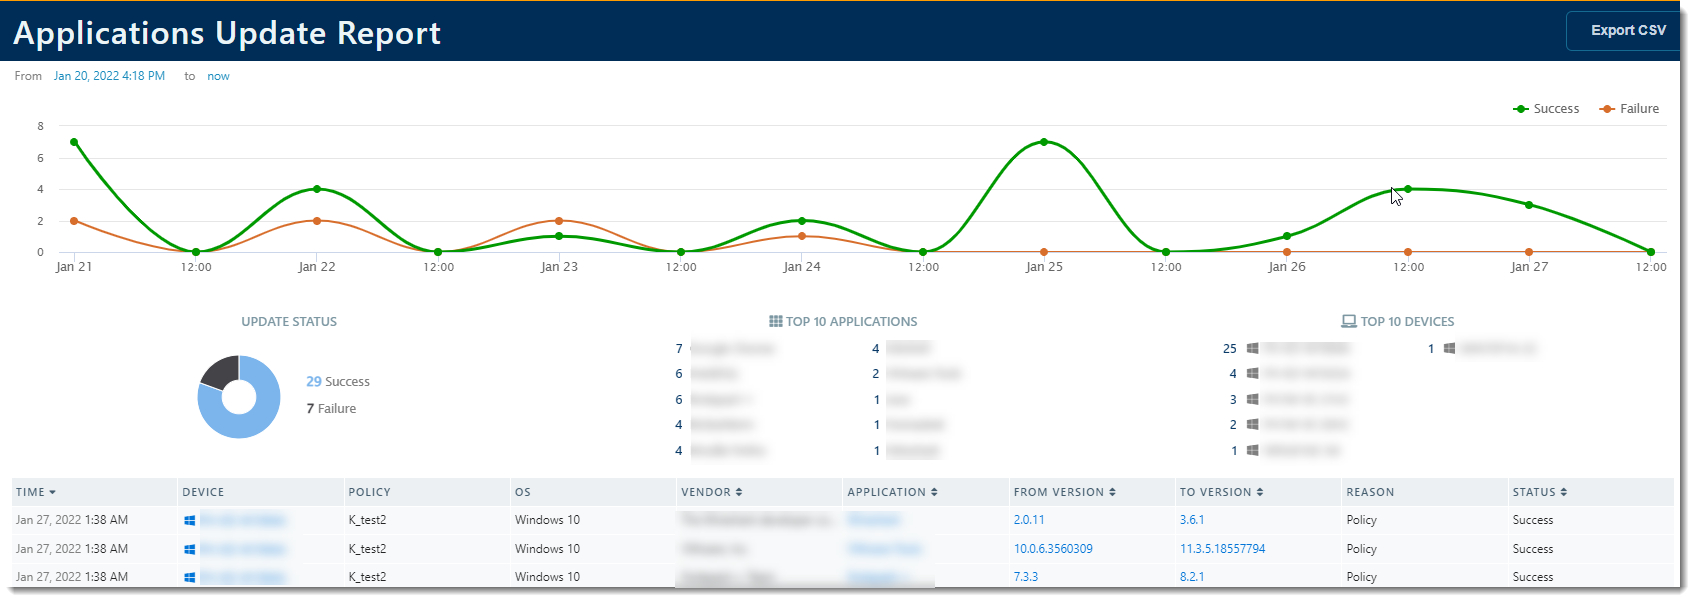
Applications Update Report
The Applications Update Report provides a detailed report of applications that need to be updated, the hostname of the device they're on, the policy the device is on, the operating system, the application, the current version, the most recent version.
On this page, you can determine a time range anytime between now and the last 30 days. There are a couple of graphs at the top of the page that indicate application update successes versus failures.
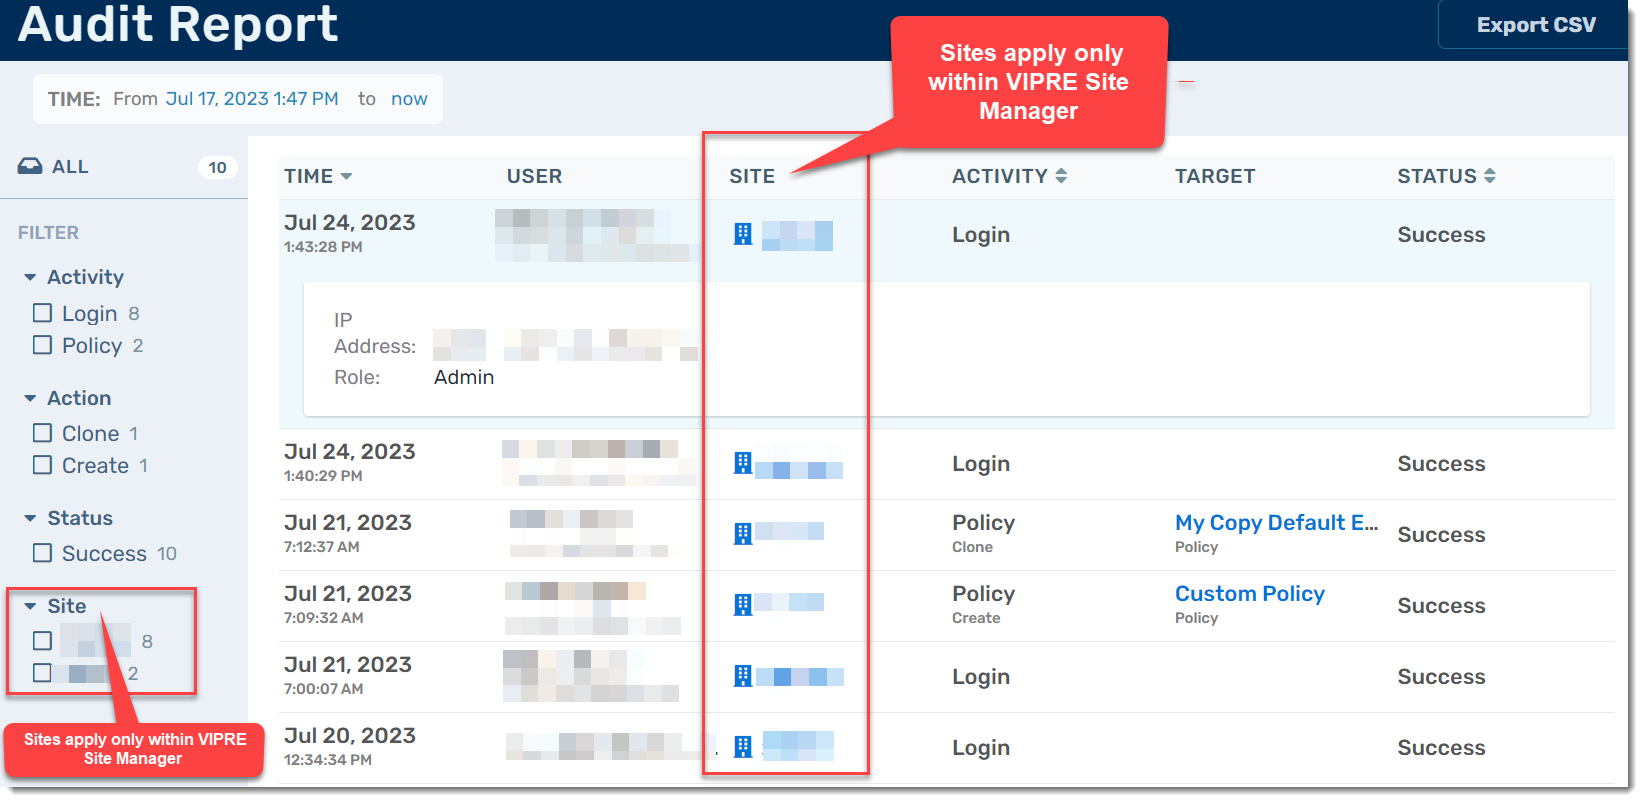
Audit Report
The Audit Report details all user actions, including when a user logs in, does a device scan, creates a notification, updates a policy, changes a user account, and more. The level of detail provided depends on the action taken. For example, a policy update will provide more detail than a user logging in.