
The VIPRE Endpoint Detection & Response (EDR) dashboard provides an overview of the data and information needed to know what actions to take to keep your organization safe.
Exploring the Dashboard
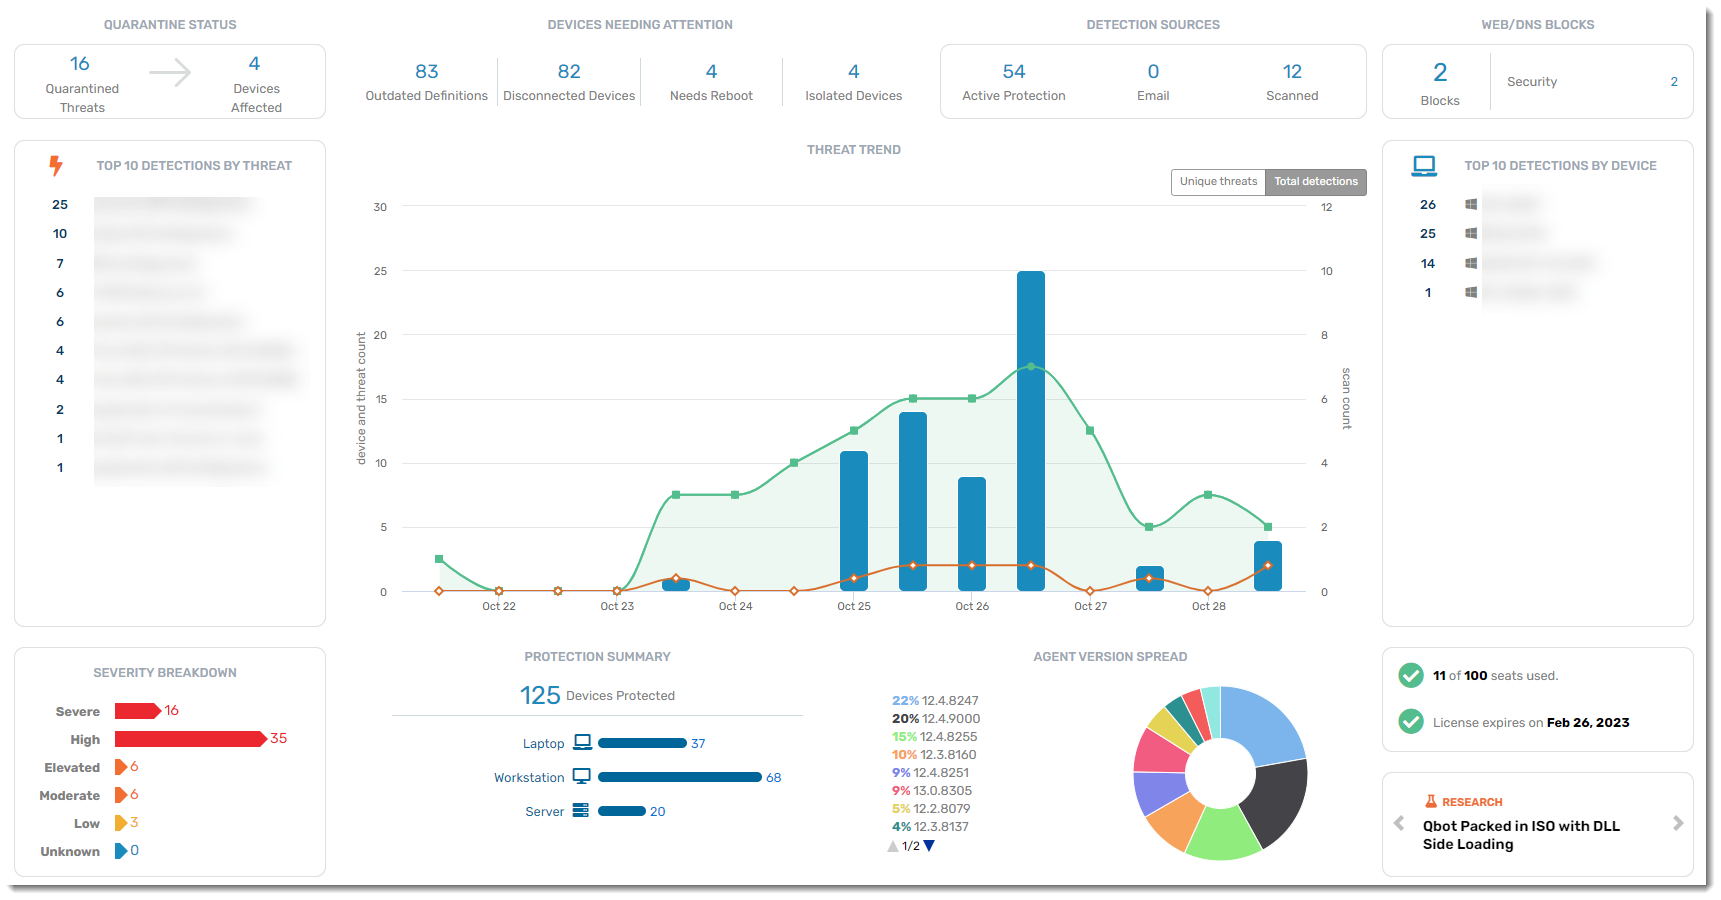
When you first log in to VIPRE EDR, the first screen you see is the Dashboard. The Dashboard is a one-stop shop to get a quick picture of the overall security posture and health of your environment. Each highly consumable section provides insight into a particular area of VIPRE's protection.
Quarantine Status
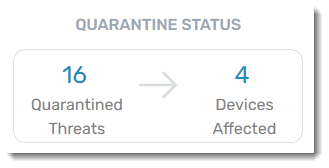
A real-time summary of the number of threats currently in quarantine and how many different devices those threats were found on. Drill down here to delete those threats or un-quarantine any file that is verified as accidentally quarantined (a false positive). The new quarantine counts will be immediately reflected on the dashboard.
Devices Needing Attention
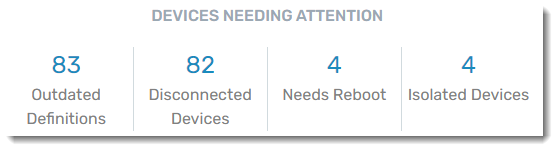
A summary of devices that may be having trouble because they:
- aren't getting signature updates; outdated definitions indicate potential security risk
- aren't communicating with VIPRE Cloud (unresponsive, shut down, etc.)
- need to be rebooted
- are isolated by a site administrator, preventing them from sending or receiving any traffic
You will want to investigate these devices to ensure that all of your systems stay protected. As each device issue is resolved, the counts will be updated on the dashboard.
Detection Sources
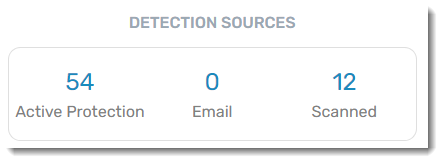
A historical summary of discovered threats and which VIPRE engine detected them
- Active Protection - the Active Protection engine, which includes on-access scanning and process behavior monitoring
- Email - the email engine that scans email contents and attachments, looking for spam, phishing, and malware patterns
- Scanned - the scanning engine that handles ad hoc or scheduled scans of your file system
Web/DNS Blocks
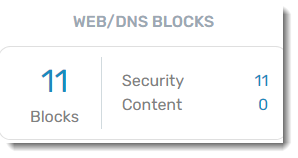
A historical summary of how many items have been blocked by Web/DNS Protection, categorized into Security blocks and Content blocks. Clicking on any of the numbers in this widget brings you to the Web Activity Summary Report. Refer to Related Articles for details about reports in EDR.
Top 10 Detections by Threat
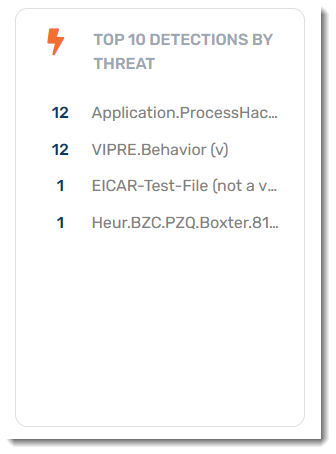
A historical summary of the top 10 active threats. Use this to ensure that no particular threat is infecting your environment. An excessive count is an indication of a widespread issue. Drill down into a threat for more details on the threat itself, the devices it has impacted, and how it was detected.
Threat Trend
A historical summary of trending threats within your organization. There are two views on this graph - unique threats and total detections - providing device, threat, and scan counts by date.
- Blue = Threats
- Green = Scans
- Orange = Devices with threats
Hovering your mouse over any of the data points provide specifics for that day. Clicking on a blue bar or orange line on a specific date takes you to the Threat Detection Report. Clicking on a green line on a specific date takes you to the Scan Report.
Top 10 Detections by Device
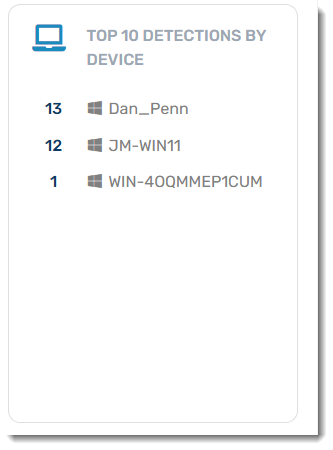
A historical summary of the top 10 devices with threats. Use this to identify which devices may be particularly susceptible to threats and that may be a particular risk to your environment.
Severity Breakdown
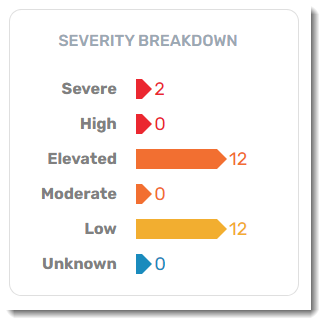
A historical summary breaking down of each threat's severity level. Clicking on each severity type will bring you to the Threat Detection Report.
Protection Summary
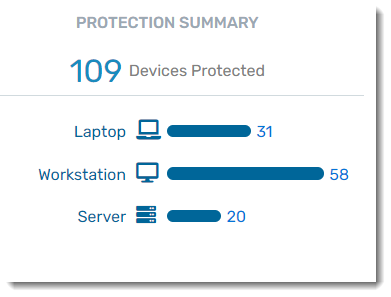
View a breakdown of the number of devices in each category that VIPRE is currently protecting. Clicking on a device type here will bring you to the Devices tab, sorted by the device type you clicked on.
Agent Version Spread
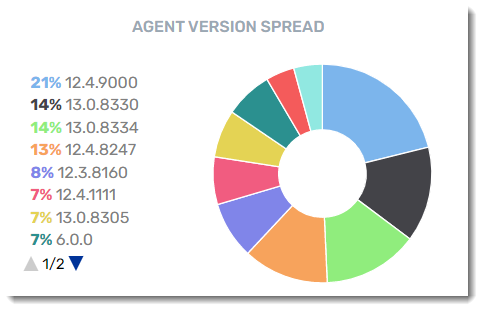
View a summary of the agent software versions that are currently deployed or available. We are continuously improving our engine detection technology, so it is always a good idea to keep your agents up to date!
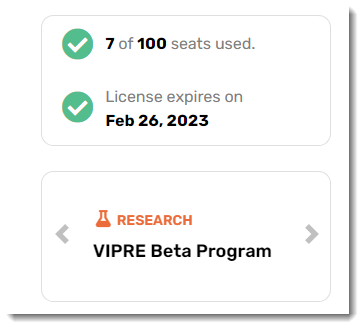
Finally, we're at the bottom of the dashboard. Here you can find the number of seats you've already consumed versus the number of seats in your package. Research will link you directly to our VIPRE Labs blog located on at https://labs.vipre.com.